The Stochastic Oscillator is a momentum indicator that shows the speed and intensity of price movements. George Lane developed it in the late 1950s.
The Stochastic Oscillator does not track price, volume, or any similar parameters, but rather the speed or momentum of prices. Typically, momentum changes direction before price.
Bullish and bearish divergences in the Stochastic Oscillator can be used to signal trend reversals. This was the first and most important signal identified by Lane. He also used this oscillator to determine bullish and bearish patterns to predict future reversals. Because the Stochastic Oscillator moves within a price range, it is also useful for identifying overbought and oversold levels.
Stochastic Oscillator values are essentially percentage expressions of the trading range of a physical asset (forex, stocks, cryptocurrencies, etc.) over a given period.
The default setting for the stochastic oscillator is 14 periods (hourly, daily, etc.). A value of 0 represents the lowest point in the trading range. A value of 100 indicates the highest point in the specified period.
What is Momentum?
Before delving deeper into the analysis of the Stochastic Oscillator, it’s important to understand what momentum is. It refers to the rate at which an asset’s price is accelerating. Momentum indicators explain how to analyze price movements and the factors that influence an indicator’s fluctuations.
How does the Stochastic Oscillator work?
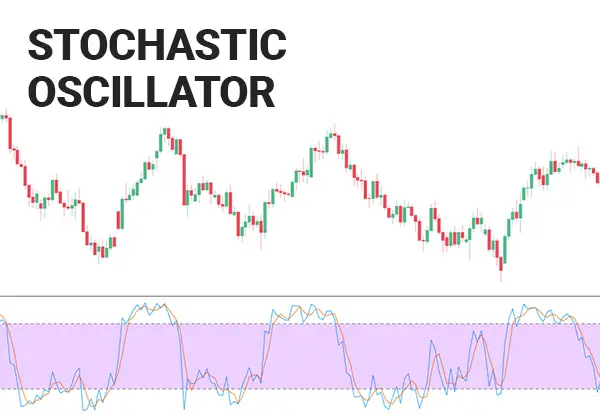
The Stochastic Oscillator compares an asset’s closing price to a wide range of highs and lows over a given period. Typically, the Stochastic Oscillator is calculated over a 14-day period. However, this period can be adjusted to suit your needs. The Stochastic Oscillator value for a given period is always between 0 and 100.
Uses of the Stochastic Oscillator
As a trading tool, the Stochastic Oscillator helps estimate when an asset is overbought or oversold. By indicating these levels, the oscillator suggests potential price reversals, helping traders identify the optimal time and price to buy or sell an asset.
When the lines are above 80, it indicates that the asset’s price is in an overbought zone; when they are below 20, it is in an oversold zone.
Your reaction to an asset entering the overbought or oversold zones of the oscillator depends entirely on your expectations (short-term or long-term) and your strategy.
For example, if an asset in an overbought zone reverses, does this indicate a slight pullback, a larger correction, or a long-term downtrend? It’s difficult to say, especially if you are only using the Stochastic Oscillator.
Depending on your investment strategy and your interpretation of the overbought signal, several decisions may be necessary.
Using the Stochastic Oscillator to Identify Overbought and Oversold Conditions
The Stochastic Oscillator is commonly used to determine whether the market is in an overbought or oversold zone. Like the Relative Strength Index (RSI), its interpretation depends on the context: the price may continue to rise in an overbought situation and fall in an oversold situation.
Therefore, it is best to use trend indicators such as moving averages and the MACD to establish the trend, or Bollinger Bands to define the trading range. Once the trend is identified, the Stochastic Oscillator can be used to confirm it and identify overbought and oversold levels.
Generally, a Stochastic Oscillator value above 80 is considered an overbought situation, and a value below 20 an oversold situation; however, some traders consider levels of 70 and 30 to be appropriate. Signals are generated when line %K (the fastest) crosses signal line %D.
Types of Stochastic Indicators
There are two main types of stochastic indicators:
Upper Stochastic
An upper stochastic occurs when an asset’s price closes near its high and continues to rise. An overbought situation is signaled when the stochastic lines are above 80, indicating a bearish market reversal. Traders are then ready to take short positions, anticipating an imminent price decline.
Lower Stochastic
A lower stochastic occurs when an asset’s price closes near its low and continues to fall. An oversold situation is signaled when the stochastic lines are below 20, indicating a bullish market reversal. Traders are then ready to take long positions, anticipating an imminent price increase.
Calculating the Stochastic Oscillator
The stochastic oscillator analyzes the amplitude of price changes over a given period, or Japanese candlestick. A typical stochastic candlestick has 14 periods per price.
The stochastic oscillator takes into account the highest and lowest points of the last 14 candlesticks and compares them to the current closing price. The formula is as follows:
K% = (Current Closing Price – Lowest Price) / (Highest Price – Lowest Price) × 100
D% = 3-day simple moving average of K%
Lowest Price = Lowest price over the analyzed period
Highest Price = Highest price over the analyzed period
K% is multiplied by 100 to shift the decimal point two places.
Advantages and Disadvantages of Using the Stochastic Oscillator
The main advantage of the Stochastic Oscillator is its ability to anticipate trend reversals, giving you ample time to analyze the market and prepare for a potential trade. Furthermore, this indicator is easy to understand and use.
Its main disadvantage lies in its poor performance in the absence of a trend. Indeed, the Stochastic Oscillator generates weak, or even erroneous, signals when markets are volatile or trading within a price range.
Reacting to false signals leads to buying or selling too early and executing stop-loss orders before reaching profit targets. If a trader’s goal is to “buy low, sell high,” trading based on false signals often has the opposite effect.
Tips for Using the Stochastic Oscillator
Traders should always keep in mind that the Stochastic Oscillator is primarily designed to measure the strength or weakness—not the direction—of price movements in the market.
Some traders attempt to mitigate the Stochastic Oscillator’s tendency to generate false signals by using more extreme values to identify overbought/oversold situations. Instead of considering values above 80 as the threshold, they interpret only values above 85 as indicating an overbought situation. Conversely, only values less than or equal to 15 are interpreted as indicating an oversold situation.
While this 85/15 setting reduces the number of false signals, it can cause traders to miss trading opportunities. For example, if the stochastic oscillator reaches a high value of 82 during an uptrend, and then the price falls, the trader may have missed a selling opportunity at an ideal price because the stochastic oscillator never reached the required overbought indicator level of 85 or higher.