Fibonacci levels are among the most popular and widely used analytical tools, thanks to their proven effectiveness in identifying support and resistance levels and analyzing future price trends. This allows traders to determine the best entry and exit points for trades. Therefore, integrating Fibonacci analysis into trading strategies can significantly improve performance, reduce risk, and optimize results.
What is Fibonacci in trading?
The Fibonacci indicator is a popular analytical tool in financial markets, used by traders to identify potential support and resistance levels based on a specific numerical sequence. This numerical sequence was discovered in the 12th century by the mathematician Leonardo Fibonacci, after whom it is named.
The Fibonacci sequence begins with the numbers 0 and 1. Each number is the sum of the two preceding numbers: 0, 1, 1, 2, 3, 5, 8, and so on.
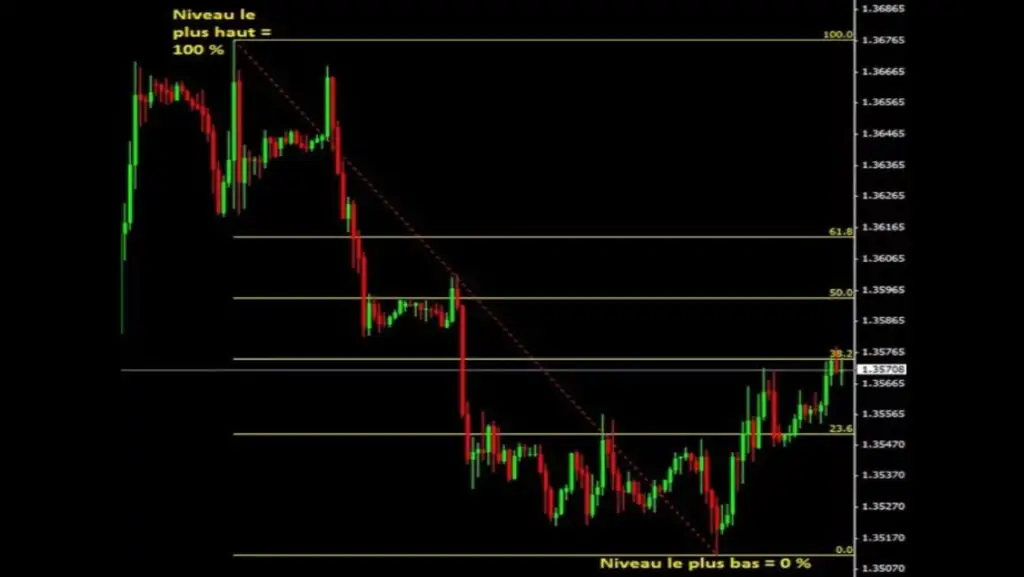
The Fibonacci sequence is associated with various ratios, such as 23.6%, 50%, and 61.8%. These ratios are used in trading, particularly in the stock, foreign exchange, and cryptocurrency markets, to anticipate price movements of financial assets. By plotting Fibonacci lines on a chart, traders can identify precise points where the price trend might reverse. If the price approaches these points, the trader can decide to place buy or sell orders based on the anticipated market reaction.
What is the Golden Ratio of Fibonacci Levels?
The Golden Ratio of Fibonacci Levels, also known as the Golden Ratio, is 61.8%. A key concept in technical analysis of financial markets, it is based on a mathematical relationship within the Fibonacci sequence. As the sequence progresses, the ratio between each number and the next tends towards 1.618 or its inverse, 0.618.
The golden ratio is an effective analytical tool for identifying potential support and resistance levels, which can represent significant inflection points in price movements.
Trading strategies based on the Fibonacci sequence primarily rely on other key derivative ratios, such as 38.2% and 50%, with the option of using broader ratios, such as 161.8%, to analyze wider price ranges.
What are Fibonacci Retracement and Extension Levels?
Fibonacci Retracement and Extension Levels are among the most important trading strategies. They help traders make more precise and effective decisions by identifying potential support and resistance points in asset price movements. This is achieved using Fibonacci ratios, which allow us to predict the levels at which the price might experience a correction or extension.
What are Fibonacci retracement levels?
Fibonacci retracement levels are a technical analysis tool used to identify potential support and resistance zones in price movements. They are based on key Fibonacci levels, such as the 38.2%, 50%, and 61.8% retracement ratios. Traders use these levels to anticipate potential market corrections before the price resumes its initial trend.
To calculate Fibonacci retracement levels, you calculate the price difference between the highest and lowest prices, multiply this difference by the corresponding Fibonacci ratio, and then add the result to the lowest price.
For example, if the price of a financial asset is $100 and increases to $120, the difference between the two prices is $20 ($120 – $100). This result is then multiplied by the Fibonacci ratios (0.382, 0.5, 0.618) and added to the price:
(20 x 0.382) + 100 = $107.64
(20 x 0.5) + 100 = $110
(20 x 0.618) + 100 = $112.36
What are Fibonacci extension levels?
Fibonacci extension levels are used to identify profit targets or estimate the potential magnitude of a price correction. These levels represent potential trend reversal zones. They are drawn as connection points between specific elements on the chart and are based on common Fibonacci extension ratios, such as 138.2%, 161.8%, and 261.8%.
Fibonacci extension levels are calculated from three different price points. The difference between the first and second points is then multiplied by the desired Fibonacci ratio, for example, 161.8%. The result is then added to the third point if an upward movement is anticipated, or subtracted from the third point if a downward movement is anticipated.
For example, if the price goes from $10 (point 1) to $20 (point 2), then back down to $15 (point 3), the result is calculated as follows: (1.618 x 10) = $16.18. This amount is then added to the third point: (16.18 + 15) = $31.18.
Other Fibonacci Strategies
Fibonacci Fan Strategy: This strategy involves drawing a series of trend lines using Fibonacci ratios to identify potential support and resistance levels. It is applied by drawing three trend lines from a significant low or high, using the Fibonacci ratios of 38.2%, 50%, and 61.8%.
Fibonacci Arcs: This strategy involves drawing a series of arcs using Fibonacci ratios to identify potential support and resistance levels. It is applied by drawing three arcs from a significant point, whether high or low, using the 38.2%, 50%, and 61.8% Fibonacci ratios.
Time Zone Strategy: This strategy relies on using Fibonacci levels to identify periods where price trends might reverse. It is applied by drawing a series of vertical lines over different time periods to identify potential trend reversal points in the market.
What are the advantages and disadvantages of Fibonacci?
Despite the effectiveness of Fibonacci levels in technical analysis, they have advantages and disadvantages that traders should consider to optimize their use and make sound trading decisions. We explain the advantages and disadvantages of Fibonacci levels in trading below:
Advantages:
Fibonacci levels provide objective data for analyzing financial markets, thus reducing the influence of emotions and feelings that can lead to poor decisions.
Fibonacci levels can be applied to various financial assets, such as stocks, futures, and forex, and are compatible with different trading styles, such as day trading or long-term trading.
Fibonacci levels help determine stop-loss and take-profit orders, thus contributing to better risk management and limiting potential losses.
Disadvantages:
While Fibonacci levels offer objective analysis, their interpretation depends on the trader’s experience and knowledge. Therefore, different traders may draw different conclusions from the same chart. Fibonacci levels are based on past price movements and do not take into account current factors such as news, economic data, and other elements that could cause sudden price fluctuations.
While Fibonacci levels are an effective analytical tool, it is not advisable to rely on them exclusively. It is best to combine them with other technical analysis tools for better results.